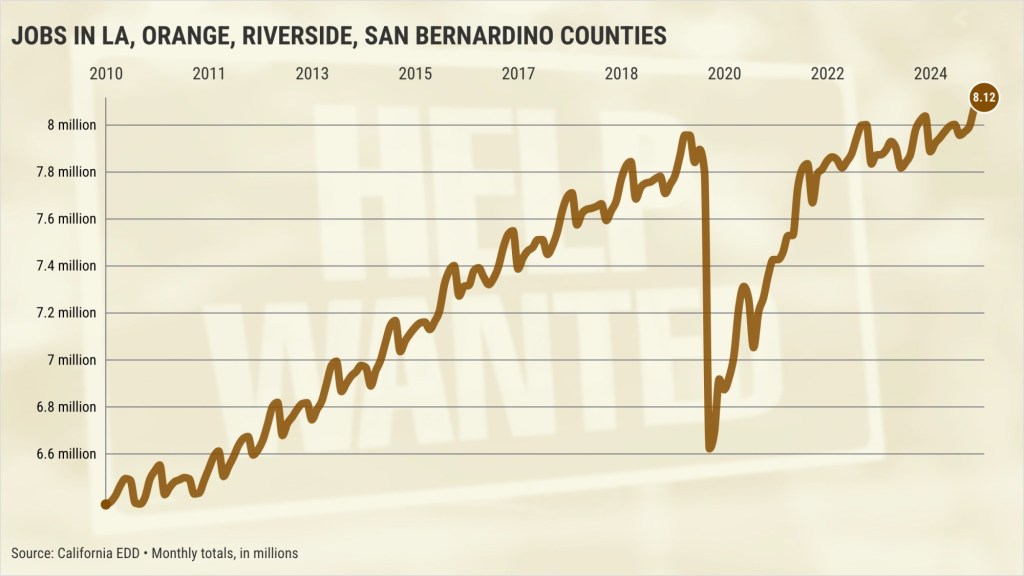
Southern California had record employment as 2024 ended, but not every industry was in a hiring mood.
My trusty spreadsheet, filled with state job figures that aren’t adjusted for seasonal swings, found an all-time high 8.1 million jobs in December in Los Angeles, Orange, Riverside and San Bernardino counties. The region added 79,300 jobs during the year.
The record was set with a 7,200 job increase from November. Yet local hiring averaged 14,640 in December between 2015 and 2019, in the years before the coronavirus.
So, what industries defied the year-end cooling?
Ponder three job niches tied to seasonal celebrations that outpaced their historic December staffing patterns. It reinforces other stats showing brisk holiday shopping.
Start with the warehouse workers who moved those online gift shipments.
The local logistics and utilities industries had 839,500 workers in December — up 5,900 in a month, topping the average December hires of 5,300 in 2015-19. And these jobs grew by 12,400 last year.
In-person shopping powered hiring patterns at local merchants.
Retail’s 771,300 workers was a 5,200 increase in a month vs. an average of 5,000 December hires in 2015-19. And retail employment is up 5,500 in a year, a hint local shoppers are returning to the malls.
And year-end dining out helped the four-county region’s sit-down restaurants.
Full-service eateries had 337,000 workers in December – up 300 in a month vs. an average December that saw 240 cuts in 2015-19. This food service category added 1,600 jobs last year.
Other growth
December job increases were found in only half of 12 other Southern California business sectors. Here are the expanding staffs, ranked by one-month changes …
Information: 221,400 workers – up 4,500 in a month vs. an average of 200 hires in 2015-19. It’s up 1,900 in a year.
Healthcare: 846,700 workers – up 900 in a month vs. an average of 3,700 hires in 2015-19. It’s up 32,300 in a year.
Hotels/entertainment/recreation: 268,100 workers – up 900 in a month vs. average 3,900 hires in 2015-19. It’s up 3,000 in a year.
Personal services: 266,800 workers – up 700 in a month vs. average 1,000 cuts in 2015-19. It’s up 200 in a year.
Fast-food restaurants: 359,200 workers – up 500 in a month vs. average 600 cuts in 2015-19. It’s up 3,800 in a year.
Financial: 362,800 workers – up 200 in a month vs. average 1,600 hires in 2015-19. It’s up 1,600 in a year.
Not in the mood
Here are what local industries cut jobs as 2024 ended, ranked by employment drop …
Construction: 368,900 workers – down 3,800 in a month vs. average 2,400 cuts in 2015-19. It’s down 8,900 in a year.
Private education: 216,900 workers – down 3,100 in a month vs. average 2,900 cuts in 2015-19. It’s up 6,100 in a year.
Government: 1.04 million workers – down 2,500 in a month vs. an average of 200 hires in 2015-19. It’s up 13,800 in a year.
Professional-business services: 1.14 million workers – down 1,600 in a month vs. an average of 400 cuts in 2015-19. It’s down 1,000 in a year.
Manufacturing: 555,900 workers – down 600 in a month vs. average 900 hires in 2015-19. It’s down 18,000 in a year.
Social assistance: 514,300 workers – down 300 in a month vs. an average of 1,400 hires in 2015-19. It’s up 25,000 in a year.
Jonathan Lansner is the business columnist for the Southern California News Group. He can be reached at jlansner@scng.com


